
Our 2nd database release of 2017 was published on 23rd March 2017. It now includes 15019 interactions between 2809 targets and 8832 ligands. For full release statistics see the About the Guide to PHARMACOLOGY page.
Target updates
The major part of the work to update the target family summary pages has been completed in advance of producing the Concise Guide to PHARMACOLOGY 2017/18 from the database, which is due out later this year. For the next version, we have been working towards trying to make the information more concise, and limiting both ligands and further reading to the 5 most useful in many cases. Obviously there are some targets where it makes sense to have more or less than 5 displayed on the summary page, but in any case, all the ligands can still be viewed on the detailed target page, and the website contains more further reading references than are included in the published Concise Guide. We are very grateful to all the contributors and the editors who have provided information.
Since most of our curation effort has gone into these updates, the only GPCR detailed page updates this time are the Gonadotrophin-releasing hormone receptors.
Ligand updates
We have refreshed our PDB ligand links and now have 1283 links from ligands to individual RCSB PDB ligand pages and the crystal structures they are found in, e.g. LSD recently crystalised with 5-HT2B.
Meanwhile, our development team has prepared the following new website features and updates:
Web services updates
The REST web services have been updated and now include interactions web services providing lists of target-ligand pairs which can be filtered by target/ligand type and properties, binding affinity etc., and references web services which can retrieve references by id or the full interaction reference set.
Graphs comparing ligand activity across species
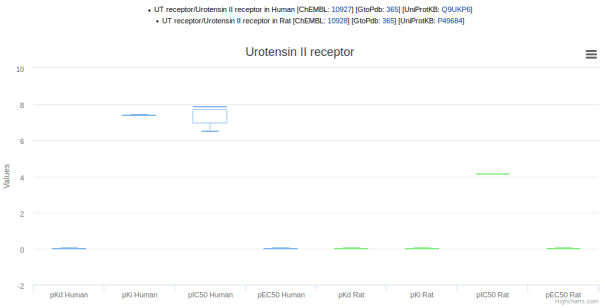
We have developed new ligand activity graphs comparing activity ranges across species using data extracted from GtoPdb and ChEMBL. These are available via the ‘biological activity’ tab (screenshot 1) on ligand pages but currently only for ligands that are also in ChEMBL. For example, DPCPX (screenshot 2) shows similar activity at A1 receptors across a range of species tested.
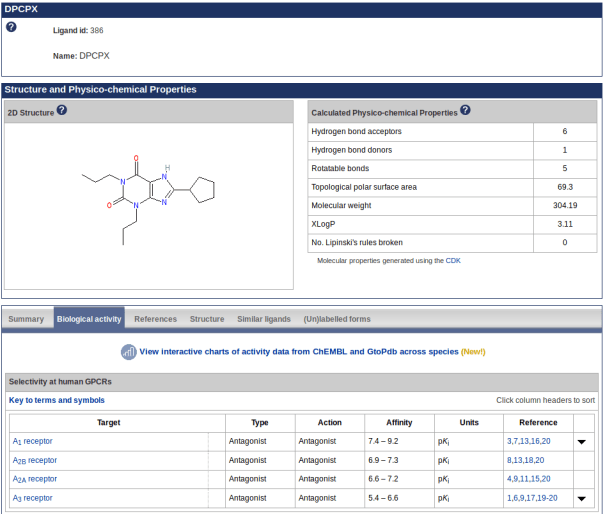
Screenshot 1. New link to view charts of activity data on the DPCPX ligand page biological activity tab

Screenshot 2. Chart showing DPCPX ligand activity data from ChEMBL and GtoPdb across 4 species. Mouse-over a plot to see the median, lower and upper quartiles, and minimum and maximum data points for each activity type.
Mouse-over a plot to see the median, interquartile range, low and high data points. A value of zero indicates that no data are available. A separate chart is created for each target, and where possible the algorithm tries to merge ChEMBL and GtoPdb targets by matching them on name and UniProt accession, for each available species. However, please note that inconsistency in naming of targets may lead to data for the same target being reported across multiple charts.
At the end of the page, below the charts, is a table listing all the data points that were used to build the charts, the source databases, assay details, and links to the original references and PubMed.
The graphs can be useful for comparing data across species when choosing model organisms to use for experiments. For example, the ligand palosuran is known to have 100-fold lower binding inhibitory potency on rat versus human UT receptor (screenshot 3).
Screenshot 3. Palosuran activity at human and rat UT receptors.
Extracting ChEMBL activities
Since ChEMBL contains an enormous amount of data (>14.3 million activities in ChEMBL 22) we have filtered and extracted the most useful data and tried to standardise them to the terms used in GtoPdb. Data are selected according to the following criteria:
- The target must have a type of ‘SINGLE PROTEIN’, ‘PROTEIN COMPLEX’, or ‘PROTEIN COMPLEX GROUP’
- Affinity types are combined and normalised as follows:
Kd = Dissociation constant, Kd, K app, K Bind, K calc, Kd’, KD app, KD’, Kd(app), KD50, Kdiss, Relative Kd, Binding constant, K aff, K diss, KD/Ki
pKd = -Log Kdiss, -Log KD50, pKd, pKD, logKd, -Log Kd, Log Kd, -Log KD, Log KD
Ki = Adjusted Ki, Ki, ki, Ki app (inact), Ki app, Ki(app), Ki_app, Ki’, Ki”, KI’, K’i, Kiact, Ki high, Ki low, KiH, KiL, Kii, KII, Kic, Ki.c, Ki comp, Ki’ uncomp
pKi = pKi(app), pKi, -Log K0.5, Log Ki, logKi, -Log Ki, pKiH, pKiL
IC50 = IC50 app, IC50, IC50 max, I50, Mean IC50, IC50H, IC50L
pIC50 = pIC50, pIC50(app), -Log I50, logIC50, log IC50, Log IC50, -Log IC50, pI50, pIC50(calc)
EC50 = EC50
pEC50 = pEC50 diss, pEC50, -Log EC50, Log EC50, logEC50
A2 = A2
pA2 = pA2, pA2(app), pA2 app, pA2/pKB - Raw data (e.g. Kis are converted into their negative log to base 10 values (e.g. pKis)
- Activities deemed by ChEMBL curators to be “outside typical range” are ignored (to prevent skew)
- Only binding (‘B’) and functional (‘F’) assays are included (no large-scale screening data)
We have tried to be as inclusive as possible with the ChEMBL data, but please note that due to the sheer volume, there will be data that have not yet been manually checked by the ChEMBL curators and we always ask users to refer back to the original references when using the data.


[…] our 2017.2 release we announced the development of ligand activity graphs which can be used to compare activity ranges across species using data extracted from GtoPdb and […]
[…] on from previous updates (releases 2017.2 and 2017.4), where we described the addition of graphs to visualise ligand activity data for […]
[…] ligands in ChEMBL v23. The ChEMBL data has been filtered according to the same rules we use for the ligand activity visualisation charts (see the help documentation for details) and as well as displaying the ChEMBL curated activity […]